

A website’s speed is defined by the ability of its pages to load and respond to user interactions within specific thresholds, as measured by Google’s Core Web Vitals: LCP under 2.5 seconds, INP under 200 ms and CLS under 0.1. Following the steps to improve website speed involves taking a systematic approach to servers, images, code and resources, in the correct order. Only the 62% from the mobile range Passes the LCP test: this figure reveals just how much room for improvement there still is for most corporate websites. According to Google, the likelihood of visitors leaving increases by 32% between 1 and 3 seconds of loading time. Every second lost costs visitors, search rankings and sales.
How to assess the website’s current performance
Before taking any action, we need to understand where the problems lie. Without accurate data, any change is a shot in the dark.
The main analytical tools
Three tools cover most of the analysis requirements for a business website:
- PageSpeed Insights: it analyses a single URL and returns both (simulated) lab data and real-world data from Google’s CrUX database. It is the most straightforward starting point for understanding how Google evaluates a website.
- Lighthouse: Integrated into Chrome DevTools, it generates detailed reports on performance, accessibility and technical SEO. Useful for in-depth diagnostics during the development phase.
- GTmetrix: It provides detailed waterfall charts showing the order in which each resource is loaded. It enables you to identify large files or requests that are slowing down rendering.
The distinction between laboratory data and field data is crucial. Laboratory data simulates controlled conditions and is reproducible, but does not reflect users’ real-world experience. Field data, collected by Chrome from real users, is what Google uses for ranking. For a comprehensive performance analysis on the website, always read both types of data together.
How to read reports and set priorities

Once you have collected the data, focus on the pages with the highest traffic and on the metrics that do not meet the thresholds. A low LCP score on an e-commerce product page has a direct impact on conversions. Make a note of which metrics are failing and on which devices: mobile and desktop often present different issues.
A tip: Carry out an initial analysis of at least three key pages on the website (the homepage, a product or service page, and the contact page) to get a representative overview, rather than relying solely on the homepage.
What are the key steps for improving TTFB?
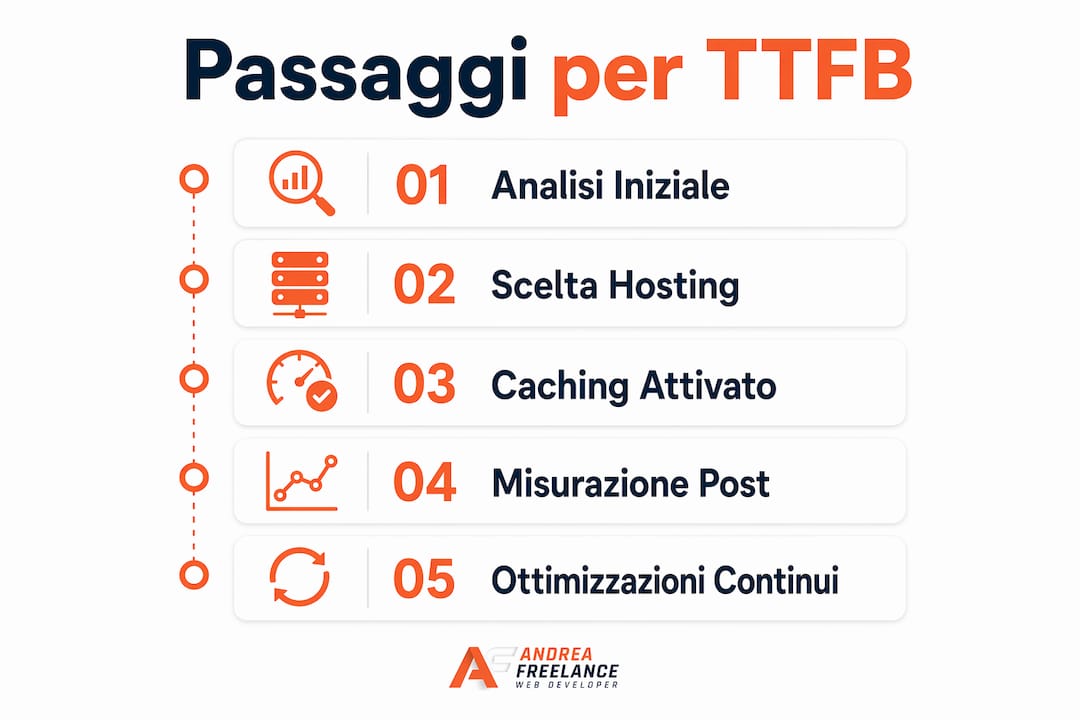
TTFB (Time to First Byte) is the metric that measures the time it takes for the server to respond to the browser’s first request. A slow server renders other front-end optimisations pointless: even perfectly compressed images and clean code are not enough if the server takes 2 seconds to respond.
Practical strategies for reducing TTFB
- Choose a high-performance hosting service. A low-cost shared hosting plan is often the main cause of high TTFB. Switching to a hosting plan with NVMe SSDs, PHP 8.x and dedicated resources measurably reduces response times.
- Enable server caching. Tools such as Redis or Memcached store the most frequently used database queries in memory. On WordPress, caching plugins such as WP Rocket or W3 Total Cache implement this logic without requiring any manual server configuration.
- Use a CDN (Content Delivery Network). A CDN distributes a website’s static files across servers located geographically close to the user. Cloudflare, for example, offers a free plan that reduces latency for visitors who are far from the main server.
- Remove unnecessary redirects. Each redirect adds an HTTP round trip. A chain of three redirects can add 300–600 ms to the perceived TTFB.
- Check for slow database queries. On WordPress sites with lots of plugins, unoptimised queries slow down every server response. Plugins such as Query Monitor help to identify them.
A tip: After changing your hosting provider or enabling caching, measure the TTFB using PageSpeed Insights 24 hours later to check the actual effect, not just the immediate one.
How can you optimise Largest Contentful Paint (LCP)?
LCP measures the loading time of the main element visible in the viewport, usually a hero image or a large block of text. In Google’s tests, improving the preload of the hero image has led to reductions from 2.6s to 1.9s. This type of optimisation is among the most effective in terms of the effort-to-result ratio.
Identify and prioritise the LCP element
The first step is to know exactly which element the browser considers to be the LCP. PageSpeed Insights highlights this in its report. On most corporate websites, this is the main image at the top of the page.
Once you have identified the component, carry out these steps in the order given:
- Add
fetchpriority="high"to the LCP image. This HTML attribute instructs the browser to download that image before any other non-critical resources. - Remove
loading="lazy"from the LCP image. Lazy loading delays the loading of images outside the viewport, but when applied to the LCP element, it has the opposite effect to the one intended. - Use modern formats: WebP or AVIF. WebP is on average 25–35% lighter than JPEG whilst offering the same visual quality. AVIF offers even better compression but has slightly lower browser compatibility. For a detailed guide on how to optimise web images, Andreafreelance has a dedicated resource.
- Always specify the width and height of images. Without these attributes, the browser does not reserve space for the image whilst it is loading, causing the layout to shift.
- Preload the LCP image with
<link rel="preload">. Posted in the’<head>on the page; this tag triggers the download of the image before the browser parses the body of the page.
A comparison of image formats for the web
| Format | Compression | Browser compatibility | Recommended use |
|---|---|---|---|
| JPEG | Media | Universal | Photographs without transparency |
| WebP | High | Excellent (Chrome, Firefox, Safari) | General images, hero image |
| AVIF | Very high | Good (Chrome, Firefox) | Images where size is critical |
| PNG | Low | Universal | Graphics with transparency |
A tip: Convert all images to WebP as a minimum standard. Use AVIF only for images where every kilobyte counts, such as hero images larger than 200KB.
How can I improve a website’s INP and CLS?
INP and CLS measure, respectively, the responsiveness to user interactions and the visual stability of the page. These are the most difficult metrics to improve because they depend on the dynamic behaviour of the code and resources.
Reducing the INP with optimised JavaScript
Blocking JavaScript and long tasks negatively impact the INP metric, slowing down the response to clicks, taps and keyboard input. A long task is any JavaScript operation that occupies the main thread for more than 50ms. Interrupting these tasks and deferring non-critical scripts reduces the INP by up to 300ms.
The most effective measures for improving the INP:
- Defer non-critical scripts with the attribute
referoasync. Analytics scripts, chat widgets and tracking pixels must not block page rendering. - Break down long tasks into smaller operations using
setTimeoutor the Scheduler API. This frees up the main thread between operations. - Load third-party scripts conditionally. Removing or deferring non-critical third-party scripts improves the INP without compromising the site’s core functionality.
- Reduce the total amount of JavaScript loaded. Each library you add comes at a cost. Consider whether each script is really necessary or whether it can be replaced with lighter native code.
Stabilise the layout using CLS corrections
CLS measures how much page elements shift position whilst the page is loading. A banner that appears after 2 seconds and pushes the text down is a classic example of a high CLS. Add width and height attributes to images and use self-hosted fonts with font-display: optional It measurably reduces eye movement.
The main fixes for CLS:
- Always specify the dimensions of images and videos in the HTML.
- USA
font-display: optionalFor web fonts: the browser uses the system font if the custom font is not yet available, thereby preventing a layout shift. - Host the fonts directly on the website’s server rather than loading them from Google Fonts or other external CDNs.
- Reserve a fixed amount of space for banners, adverts and dynamic content before they are loaded.
A tip: Test the CLS on mobile devices using a simulated 4G connection in Lighthouse. Layout shifts are much more noticeable on slow connections and on small screens.
How can we maintain performance over time?
Achieving good scores once is not enough. A website’s performance deteriorates over time due to the addition of new plugins, theme updates, marketing scripts and unoptimised content. Continuous optimisation, involving regular monitoring and audits, is what sets apart websites that maintain high performance from those that decline.
Tools and practices for ongoing monitoring
Use these tools regularly:
- Google Search Console: The «Page Experience» section displays aggregated CrUX data for the site and highlights URLs with Core Web Vitals issues.
- CrUX Dashboard: available via Looker Studio, it allows you to view the historical trends of metrics over time.
- CoreDash: a tool designed to monitor Core Web Vitals in real time, useful for those who manage multiple websites or want automatic alerts about performance regressions.
Please bear in mind that CrUX data can take up to 28 days to reflect actual changes in performance. Plan your checks on a monthly basis and do not expect immediate results in the field data.
An effective monitoring process involves the following steps:
- Carry out a full audit using PageSpeed Insights after every significant change to the website.
- Check Search Console every two weeks to identify any new URLs with issues.
- Review the list of active plugins every quarter and remove any that are not needed.
- Test performance after every theme or core plugin update.
A tip: Create a spreadsheet containing the LCP, INP and CLS scores for the main pages, updated monthly. Having a visual history makes any deterioration immediately apparent.
Key points
Website speed can only be reliably improved by following a specific sequence: TTFB first, then LCP, INP and CLS, with continuous monitoring to maintain these results over time.
| Full stop | Details |
|---|---|
| Check before taking any action | Use PageSpeed Insights and Lighthouse to identify critical metrics before making any changes. |
| TTFB is the top priority | A slow server undermines any front-end optimisation: tackle hosting and caching as a first step. |
| LCP depends on the images | Use `fetchpriority`, WebP and `preload` to bring the LCP below 2.5 seconds on key pages. |
| INP and CLS require clean code | Defer non-critical JavaScript and specify image dimensions to eliminate instability and delays. |
| Monitoring prevents setbacks | Check Search Console and CrUX data every month to spot any issues before they get worse. |
My experience with speed optimisation
After more than 20 years of working on WordPress, WooCommerce and Prestashop sites, I’ve learnt something that many professionals only realise later on: the order in which tasks are carried out matters just as much as the tasks themselves.
I’ve seen companies spend hours compressing images and installing caching plugins, only to achieve marginal improvements, because the real problem was shared hosting with a TTFB of 1.8 seconds. Until the server issue is resolved, everything else is just window dressing.
The most common mistake I come across is treating speed optimisation as a one-off task rather than an ongoing process. A website that currently meets all the Core Web Vitals metrics may see its performance deteriorate within three months following the installation of a poorly configured marketing plugin or a theme update that introduces unnecessary CSS. The structure of a high-performing corporate website It must be designed with speed as a constraint, not as a finishing touch.
Another practical point: investing in a higher-quality hosting service is almost always the move that delivers the best return. Saving €10–15 a month on a budget plan comes at the cost of lower conversion rates and poorer rankings in search results. The data speaks for itself: conversion rate improvements of between 10 and 30% have been documented for websites that switch from slow loading times to fast-loading pages. This is an economic argument, not just a technical one.
My final piece of advice is simple: follow the sequence TTFB, LCP, INP, CLS. Don’t skip any steps. Measure after each change. And treat monthly monitoring as a routine part of site management, not as a one-off task.
— Andrea
Andreafreelance: for your website’s speed and performance
If you have read this guide and recognise the issues described on your website, the next step is a structured professional intervention. Andreafreelance offers services such as website redesign and optimisation which include performance analysis, optimisation of Core Web Vitals metrics and comprehensive technical optimisation. With over 20 years’ experience with WordPress, WooCommerce and PrestaShop, every project is based on real data and delivers measurable results. If you’re also looking for a experienced web developer As a company that manages the entire process, from diagnosis to implementation, Andreafreelance is the go-to partner for Italian SMEs and digital professionals.
Frequently Asked Questions
What is TTFB and why does it affect speed?
TTFB (Time to First Byte) measures the time it takes for the server to respond to the browser’s first request. A high TTFB slows down all other performance metrics, including LCP.
What are the Core Web Vitals thresholds for 2026?
The thresholds defined by Google are: LCP below 2.5 seconds, INP below 200 ms and CLS below 0.1, measured at the 75th percentile in CrUX field data.
How long does it take to see improvements in Google’s data?
CrUX data can take up to 28 days to reflect actual changes in performance. Schedule checks on a monthly basis following any significant changes.
Does the WebP format really improve performance?
WebP reduces image file sizes by 25–35% compared to JPEG whilst maintaining the same visual quality. This reduction speeds up LCP loading and improves the user experience on mobile connections.
How do you reduce the CLS on a WordPress site?
Always specify the width and height of images; use font-display: optional for web fonts and hosts the fonts directly on the website’s server. These three measures eliminate most layout shifts.